
BBC News: New AI Technology to Track Maritime Emissions
A new system using artificial intelligence (AI) to track the sources and movement of shipping emissions has been launched following extensive testing in Plymouth Sound....
By Jean Joy, Earth Observation Consultant, Satellite Applications Catapult
Satellites can now see pollution from ships across Europe’s busiest shipping lanes. The question that regulators and business want to understand is which ship caused it. Ships carry more than 80% of world trade by volume and produce around 3% of global greenhouse gas emissions according to UNCTAD’s Review of Maritime Transport,1 along with nitrogen oxides and sulphur dioxide that affect air quality in port cities. To mitigate the impact caused by these emissions, the International Maritime Organization (IMO) has set industry a target of net zero by or around 2050, with cuts of at least 20% by 2030 and 70% by 2040 against 2008 levels.2
Those targets now come with a price. Since 2024, shipping companies have had to buy allowances under the EU Emissions Trading System for voyages to and from European ports,3 and since July 2026 the UK scheme has also covered domestic shipping over 5,000 gross tonnage and above.4 When emissions cost money, independent evidence of where they come from is worth paying for. That is a commercial opportunity for UK companies that can supply that evidence from space.
80%+: share of world trade by volume carried by ships1
3%: shipping’s share of global greenhouse gas emissions1
2050: IMO target date for net zero2
July 2026: UK Emissions Trading Scheme extended to domestic shipping4
On 23 September, Satellite Applications Catapult hosted a webinar with speakers from the European Space Agency (ESA), Spanish space technology group GMV, Ocean OS, GHGSat, the French climate research laboratory LSCE (Laboratoire des Sciences du Climat et de l’Environnement) and Science Partners Research Cooperative. They presented two projects that tackle the problem from opposite ends. EO4SEM (Earth Observation for Ship Emission Monitoring), funded by ESA and led by GMV, is testing whether satellites can measure ship emissions across European waters reliably enough to support regulation. EMMA, a UK project led by Ocean OS, works at the scale of a single port, combining satellite data, ship tracking and sensors on shore to work out which vessels are behind pollution events in Plymouth Sound. Between them, they cover the chain from spotting emissions at sea to evidence a port or regulator can act on.
Together, the two projects show the chain taking shape. More data from new missions, methods that a European regulator is helping to test, and UK software that turns observations into evidence for a single port. The next step is proving it works well enough for customers to pay for it. EMMA’s next phase will test how reliable its matches are, with more validation, longer data records and additional satellite sources. EO4SEM will continue its work with EMSA towards routine monitoring of shipping emissions in Europe.
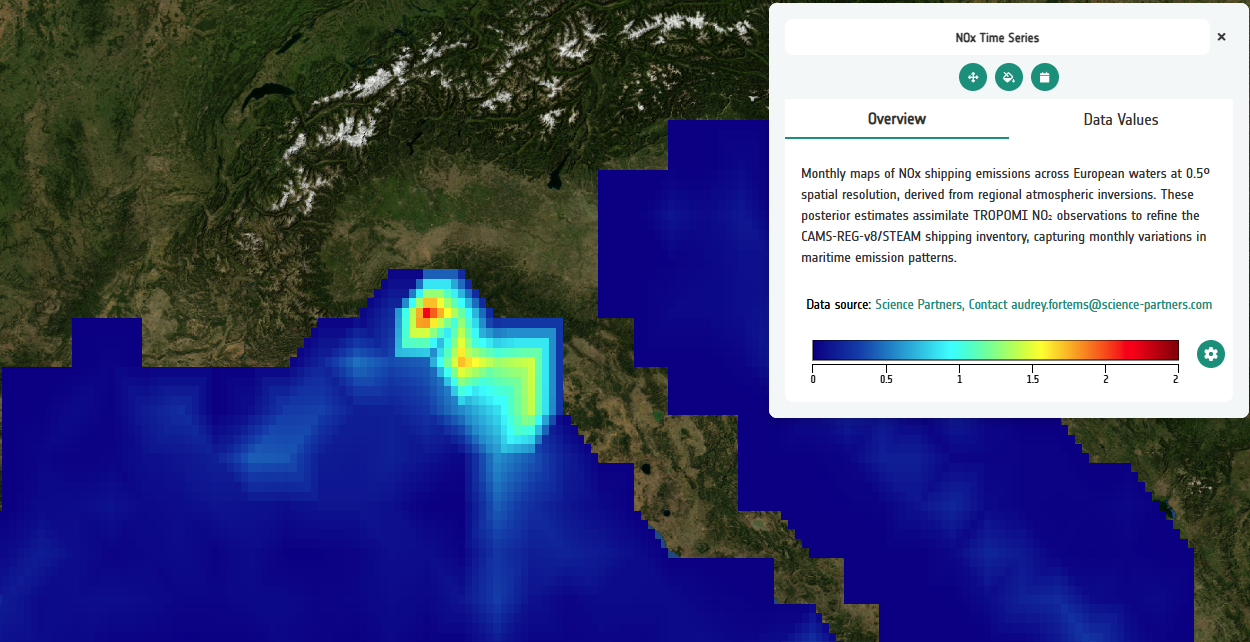
Satellite data can track emissions along shipping routes, in ports and around the coast. ©EO4SEM – Geospatial Explorer
Most shipping emissions figures are estimates. They are calculated from ship movements, engine types and fuel models, and depend on what operators report. These methods are essential, but they carry uncertainty and are hard to verify independently. Once emissions carry a price, that uncertainty costs business money.
Satellites offer a second, independent source of evidence. They measure pollutants and greenhouse gases across open sea, shipping lanes and ports. Combined with ship tracking, weather data and atmospheric models, they show where emissions occur and, increasingly, which ships they came from. That lets ports, regulators and operators check reported figures against what is in the air.
Opening the webinar, Antony Delavois of ESA explained why ESA backs projects such as EO4SEM: to turn satellite data into evidence that environmental policy can rely on. Two new Copernicus missions launched in 2025 will add hourly pollution monitoring over Europe and daily global coverage. Copernicus’ data sets are free to use, so each new mission gives UK companies more raw material for commercial services.
EO4SEM is testing whether satellites can track nitrogen oxides, carbon dioxide and methane from shipping well enough to support EU regulation, and the European Maritime Safety Agency (EMSA) is helping to test the method. Today’s instruments can already map emissions along Europe’s main shipping lanes, but their pixels are kilometres across: fine for a shipping lane, too coarse to tell one ship from another in a crowded port.
EMMA works at the other end of the chain. Led by Ocean OS with Satellite Applications Catapult, B4T Group and the University of Plymouth, it uses Plymouth Sound as a testbed to work out which vessels are behind pollution events. The University of Plymouth describes the goal as a weather forecast for maritime emissions.
That leaves the hardest part. Spotting raised pollution levels is one thing. Proving which ship caused them is another, and it is the answer ports and regulators will pay for.
Satellite Applications Catapult is testing whether Sentinel-2, a satellite built to map land in pixels tens of metres across, can pick out nitrogen dioxide plumes in a busy port, and is feeding the results into EMMA as another line of evidence. Satellite data alone cannot prove which ship caused a pollution event. Combined with ship tracking, weather data and ground sensors, they narrow the field. That is the first step towards evidence that can stand up in a compliance check.
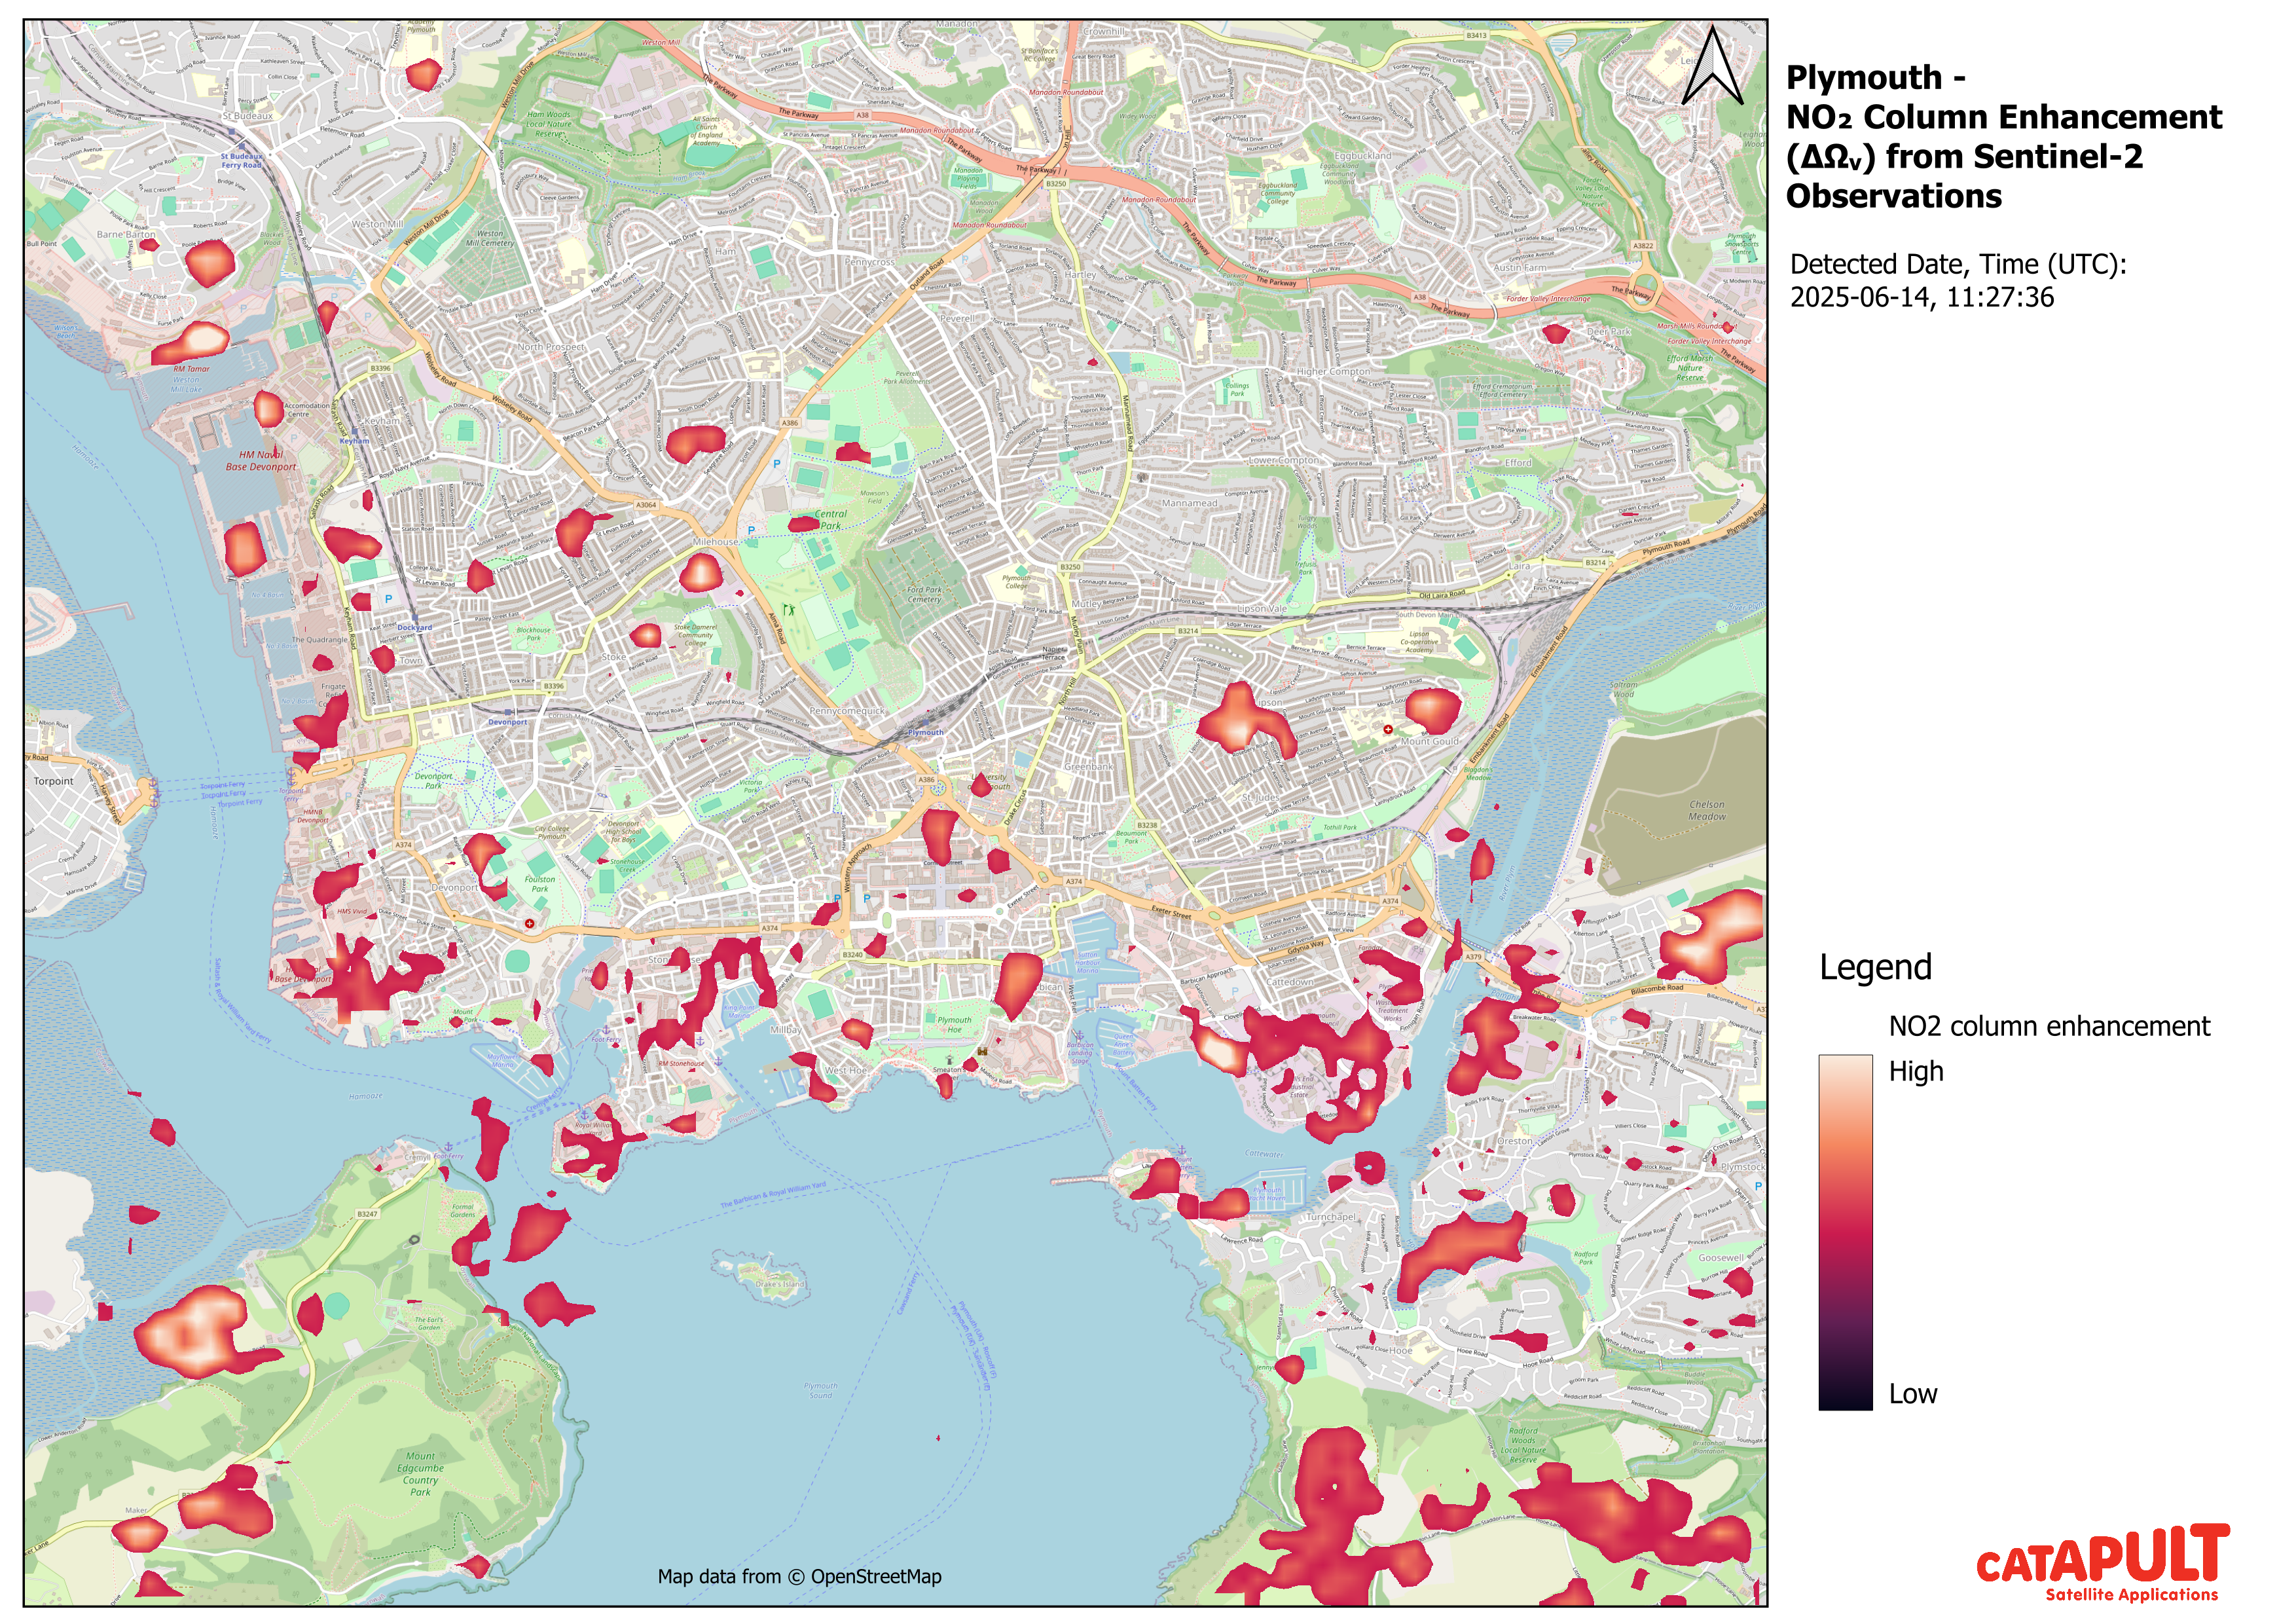
Sentinel-2 processing shows how higher-resolution observations could help identify emission sources. (Contains modified Copernicus Sentinel data 2025, processed by SAC.)
This is where the pieces come together. Ocean OS’s platform combines satellite data, ship movements, weather, air-quality readings and atmospheric modelling. Using machine learning and source-apportionment techniques, it estimates which maritime activities are most likely behind a pollution event, and how confident it is in each match.
For a port, that means knowing which ships are behind pollution spikes near the waterfront. For a regulator, it is a way to check reported emissions and for an operator, it is evidence of compliance.
Satellite Applications Catapult is a technical partner in EMMA. We help UK companies such as Ocean OS test their services with real users and find routes to market. Jean leads the Earth observation strand of EMMA at the Satellite Applications Catapult, using satellite data to detect ship emissions around UK ports. Their work adapts and validates published nitrogen dioxide detection methods, with early demonstration work at Plymouth Sound.
Work with us. If you run a port, regulate shipping or operate ships and want to test what this evidence could do for you, contact Catapult’s Mission Intervention Manager, Sarah Cheesbrough at sarah.cheesbrough@sa.catapult.org.uk. If you are a UK company with maritime emissions data or analytics, we would like to hear from you too.
Missed the webinar? Watch the full recording to hear from ESA, GMV, GHGSat, Ocean OS and the other speakers.
3. European Commission, Reducing emissions from the shipping sector.
4. UK ETS Authority, UK ETS scope expansion: domestic maritime – main Authority response. GOV.UK.
5. Varon, D. J. et al. (2024) Quantifying NOx point sources with Landsat and Sentinel-2 satellite observations of NO2 plumes. Proceedings of the National Academy of Sciences (PNAS).
Opening the webinar, Antony Delavois, Atmospheric Composition Applications Scientist at ESA, explained why ESA backs projects such as EO4SEM: to turn satellite data into evidence that environmental policy can rely on. The supply of that data is about to grow.
Two new Copernicus missions launched in 2025. Sentinel-4 will measure air pollution over Europe every hour, with its operational service expected in 2027. Sentinel-5 will add daily global coverage once commissioning is complete. Copernicus data are free to use, so each new mission gives UK companies more raw material for commercial services.
EO4SEM looks at the problem across a whole continent. Funded through ESA’s Sentinel User Preparation initiative, it brings together GMV (including its UK business, GMV NSL), GHGSat, LSCE, the Finnish Meteorological Institute, French aerospace laboratory ONERA and Science Partners. The aim is to show that satellites can track nitrogen oxides, carbon dioxide and methane from shipping well enough to support EU regulation. The European Maritime Safety Agency (EMSA), which helps enforce EU shipping rules, hosted the project’s mid-term review in late 2025. If the regulator trusts the method, it can become the basis for an operational service.
The webinar showed what is already possible. Data from the TROPOMI instrument on the Sentinel-5P satellite can estimate nitrogen oxide (NOx) emissions along Europe’s main shipping lanes, and modelling can track how those emissions change over time. But TROPOMI sees the sea in pixels of roughly 5.5 by 3.5 kilometres. That is fine for a shipping lane, but too coarse to tell one ship from another in a crowded port.
GHGSat showed what the commercial end of this market looks like. The company provides methane data from its own satellite constellation, and presented work detecting methane from liquefied natural gas (LNG) operations and other maritime activity. These emissions are hard to measure from the ground, and they matter more as more ships run on LNG.
EO4SEM is sharing its results through ESA’s APEX platform so that others can reuse the project’s data and tools.
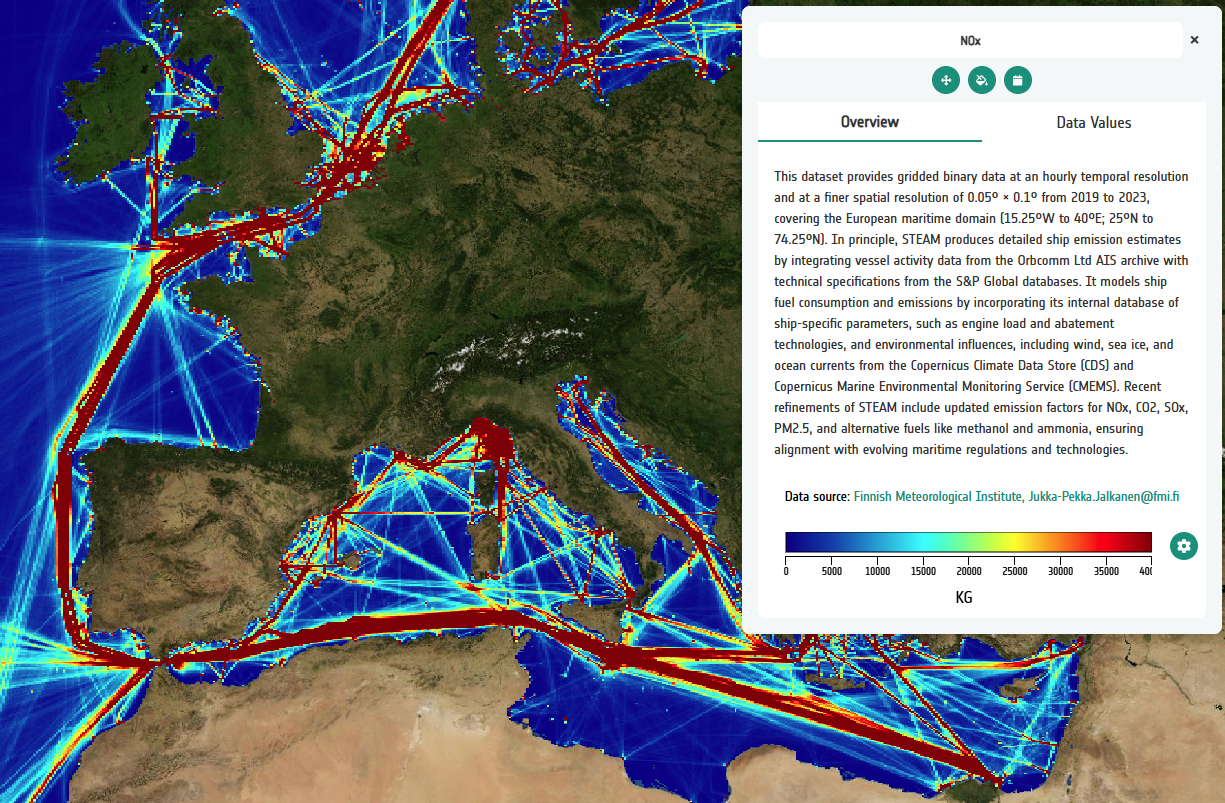
EO4SEM combines satellite observations and atmospheric modelling to estimate emissions along Europe’s shipping routes. ©EO4SEM – Geospatial Explorer
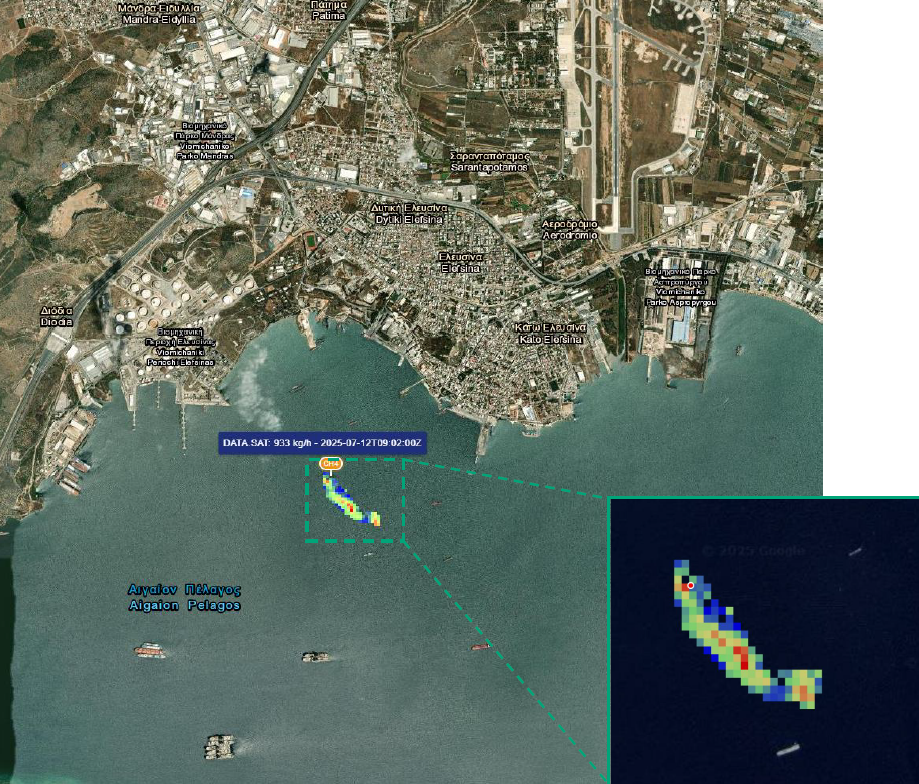
High-resolution satellite data can detect methane emissions linked to maritime activity. ©2023 GHGSat Inc.
Where EO4SEM looks across Europe, EMMA zooms in on Plymouth Sound. The project is led by UK company Ocean OS, working with Satellite Applications Catapult, B4T Group and the University of Plymouth, with support from Plymouth Marine Laboratory. It was funded through round 6 of the Clean Maritime Demonstration Competition, part of the UK Shipping Office for Reducing Emissions (UK SHORE) programme delivered by Innovate UK and the Department for Transport.
The University of Plymouth describes the goal as a weather forecast for maritime emissions: a system that predicts, maps and explains how pollution from ships spreads in real coastal conditions, and where it came from.
To do that, EMMA combines satellite imagery, ship tracking data from the Automatic Identification System (AIS), weather data, air-quality sensors on shore, atmospheric modelling and machine learning.
As Josh McCarty of Ocean OS put it, the aim is a single chain of evidence linking what satellites see, what ships are doing on the water and what sensors measure on shore. The commercial plan is just as clear. Ocean OS intends to offer EMMA as a data service for port authorities, ship operators and environmental agencies, and to extend it from Plymouth to the wider UK coast.
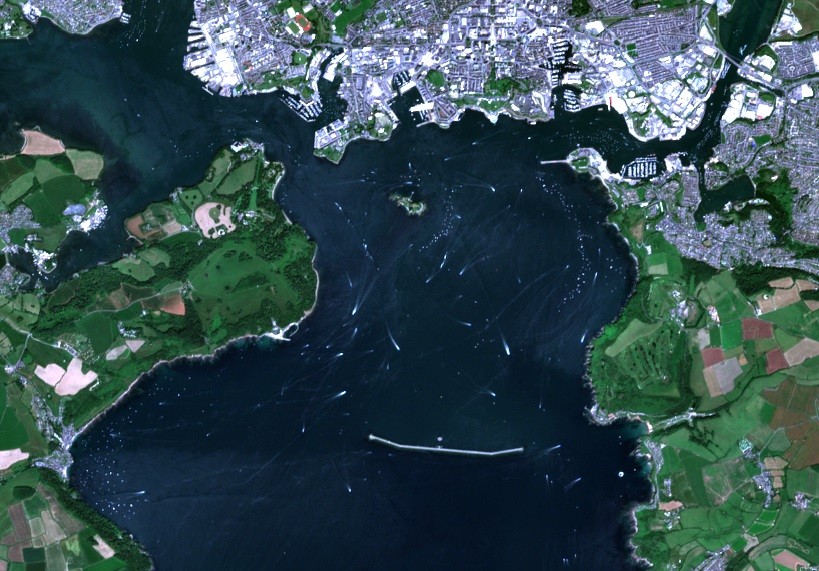
EMMA uses Plymouth as a testbed, combining satellite data, shore-based sensors and ship tracking.
Satellite Applications Catapult presented research testing whether Sentinel-2 could help. Sentinel-2 was built to map land, but in 2024 a team led by Daniel Varon showed in the journal PNAS that it can detect nitrogen dioxide (NO₂) plumes from individual power plants5 in pixels tens of metres across, rather than kilometres. Ships are smaller and they move, so the Catapult’s work tests whether the same approach holds up in a busy port.
The team built an automated processing workflow that feeds these observations into EMMA as another line of evidence. Satellite data alone cannot prove which ship caused a pollution event. Combined with ship tracking, weather data and ground sensors, they narrow the field. That is the first step towards evidence that can stand up in a compliance check.

A new system using artificial intelligence (AI) to track the sources and movement of shipping emissions has been launched following extensive testing in Plymouth Sound....
Jean Joy1 -EO Consultant, Liz Scott2– Geospatial Solutions Architect, Geospatial Intelligence Team at the Satellite Applications Catapult Introduction This poster presents the findings of a...