Kx

Introduction
During 2019, the Satellite Applications Catapult Geospatial-Intelligence department engaged with Kx and its Space solutions team. The purpose of our collaboration was to evaluate how the Kx technology stack with its integrated programming and visualization tools could help us to better interrogate and use geospatial and spatiotemporal data.
Geospatial data is data about objects, events, or phenomena that have a location on the surface of the earth. Geospatial data combines location information (usually coordinates on the earth), attribute information (the characteristics of the object, event, or phenomena concerned). Spatio-temporal data is used in data analysis when data is collected across both space and time to describe an event in a certain location and time — for example, shipping movements across a geographic area over time. Spatial-temporal reasoning is used primarily to solve multi-step problems by envisioning how objects move in space and time.
Project Summary
The Catapult Geospatial Intelligence Engineering team has built up a high level of expertise in data sets derived from Automatic Identification System (AIS) messages. AIS is an automated tracking system that uses transponders on ships, operating in the VHF mobile maritime band, and is used by vessel traffic services. AIS information supplements marine radar, which continues to be the primary method of collision avoidance for water transport. Information provided by AIS equipment includes unique identification, position, course, and speed.
The working mode of AIS is continuous, autonomous and global. The AIS data is point transmission data of the locations of ships at sea. Originally designed as a line of sight collision avoidance system it is now monitored by satellite globally and although the dataset cannot always be consistent it provides reasonably high update frequency.AIS is widely used by authorities to track and monitor the activities of national fishing fleets. AIS enables national organizations to confidently monitor fishing vessel activities along their coastline, typically out to a range of 100 km (60 mi), depending on location and quality of coast-based receivers/base stations with supplementary data from satellite-based networks.
In the context of this POC, we wanted to analyze a large amount of spatio-temporal maritime data. The Kx tech stack has many components that attracted our interest:
- An adaptable framework for the collection and analysis of data
- The capability to process and analyze millions of records in real-time data streams, with a framework for on-the-fly analysis
- A user-friendly visualization suite
Based on this capability we asked Kx to:
- Ingest large amounts of data from an AWS S3 bucket storage
- Create high performing analytics on the spatio-temporal data and return positional information results
- Demonstrate Kx’s ability to ingest and convert other data formats through the use of the Fusion for Kx library
- Perform a set of two specific geospatial queries:
- All vessels in the English Channel on a day in the dataset – obtain sub-second responses
- Vessels that are within one mile of another ship and traveling slowly (classified as transshipment activities) – receive responses in less than an hour
Kx Solution
Kx installed its technology on the Satellite Application Catapult Climate, Environment and Monitoring from Space (CEMS) cloud computing infrastructure.
CEMS is a unique, purpose-built service offering space-based climate change and Earth Observation (EO) data and services in conjunction with Infrastructure as a Service (IaaS) cloud-based computing.
A virtual machine (VM) with the following specification was created for the project team:
- 32 GB Ram
- 8 vCPU virtual cores available for I/O and kdb+
- 100GB free disk space
- Linux OS
The VM had access to an S3 bucket that had been previously loaded with three months of AIS datasets. The data was manually pulled from the S3 buckets and placed in the database for the VM’s Kx install.
There are many types of messages defined in the protocol but for this POC, we focused on two of the main message types – position and information. Position messages include the location and velocity of the ship. Information messages have details about the ship, name, size, type, etc.
Other message types include static assets (lighthouses and buoys), SAR Aircraft, and requests for information. Each message type has a number from 1 to 27. Our interest was in eight number types for the position messages: 1, 2, 3, 18, 19, and 27. For the extra information types, we used messages 5 and 24. For this project, we decided to exclude and discard any other message types.
The key joining up messages from the same ship is a field called the Maritime Mobile Service Identity (MMSI), that can be reset by the operator. The MMSI is an international and unique ship identifier and is critical in making sense of the datasets.
AIS Broadcast Information
According to Wikipedia, an AIS transceiver sends the following data every 2 to 10 seconds depending on a vessel’s speed while underway, and every 3 minutes while a vessel is at anchor:
- The vessel’s Maritime Mobile Service Identity(MMSI) – a unique nine-digit identification number.
- Navigation status – “at anchor”, “underway using engine(s)”, “not under command”, etc.
- Rate of turn – right or left, from 0 to 720 degrees per minute, as indicated by an external sensor
- Speed over ground– 0.1-knot (0.19 km/h) resolution from 0 to 102 knots (189 km/h)
- Positional accuracy:
- Longitude – to 0.0001 minutes
- Latitude – to 0.0001 minutes
- Course over ground– relative to true north to 0.1 degrees
- True heading – 0 to 359 degrees (for example from a gyrocompass)
- True bearing at its own position. 0 to 359 degrees
- UTC Seconds – The seconds’ field of the UTC time when these data were generated. A complete timestamp is not present.
Also, the following data are broadcast every 6 minutes:
- International Maritime Organization ship identification number – a seven-digit number that remains unchanged upon transfer of the ship’s registration to another country
- Radio call sign – international radio call sign, up to seven characters, assigned to the vessel by its country of registry
- Name – 20 characters to represent the name of the vessel
- Type of ship/cargo
- Dimensions of ship – to the nearest meter
- Location of positioning system’s (e.g., GPS) antenna onboard the vessel – in meters aft of bow and meters port or starboard
- Type of positioning systems – such as GPS, DGPS, or LORAN-C
- Draught of ship – 0.1 meters to 25.5 meters
- Destination – max. 20 characters
- ETA (estimated time of arrival) at destination – UTC month/date, hour, minute
- optional: high precision time request, a vessel can request other vessels provide a high precision UTC and date stamp.
The Kx team used a Python script (see snapshot below), that decoded the AIS data line-by-line.
The AIS decoder-script was written in python. You can check out the full script on GitHub
The python script was run from within a q session using embedPy components in kdb+. EmbedPy allows python to be easily integrated with kdb+.
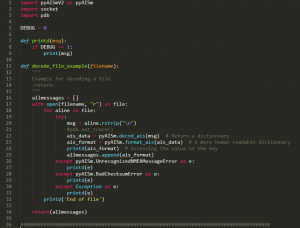
Figure 1 Python AIS decoder
A multi-threading approach was used for the data ingestion process. Separate processes were opened at the beginning of the ingestion cycle, with each process (or worker) decoding one file. Once all files were decoded, parsed into kdb+ formatted data and categorized into appropriate tables a master process saved down all the data from the child process.
The following table outlines the benchmark created during the ingestion process.
It is important to note that further optimization could be made by converting the python decoder into a kdb+ script. The python script was used due to time constraints of the POC.
| Days of Data | Number of Files | Raw data disk space usage | Data Ingestion Time | Messages/second | Kdb+ formatted data disk space usage |
|---|---|---|---|---|---|
| 1 | 96 | 3.6 GB | 20 mins 18 secs | Approx. 39,979 msg/s | 3.9 GB |
| 7 | 666 | 22 GB | 2 hrs 20 mins 41 secs | Approx. 39,033 msg/s | 27 GB |
Table 1 Ingestion Performances
It is worth noting that spatio-temporal data such as location data is one of the largest types of data being collected today. Traditional RDBMSs can no longer keep up with the volume of data, and thus researchers and industry have begun exploring alternative data persistence and query technologies for large scale datasets. We were keen to see the performance of the Kx analytics platform in extracting information in space and time.
Query 1: Creating A Heat Map of the English Channel
The first query that we asked Kx to perform, using one week’s worth of data was the Heat Map of the English Channel highlighting the density of data in gradients of color. A geographical representation of data, a heat map is one of the best ways to get a quick understanding of your data by summarizing it in a single view.
Kx also configured the frontend dashboards to give us the ability to select our preferred screen to operate (perform our query) and input our parameters and then visualize the query results.

Figure 2 Heat Map of the English Channel
| Number of records being queried | Execution time | Space used (in memory) |
|---|---|---|
| 258,545,679 | 3.566 sec | 5,100,286,800 bytes |
Table 2 Heat Map query performance
When working with AIS data, an important component is the visualization component. The AIS data contains information of all the ships that are navigating, and this can be overwhelming for users as they try to digest everything at once.
We asked Kx to query and visualize one week of data for the English Channel. How to represent the vessels was important to us. A meaningful and illustrative visualization can help the user to effectively direct their attention to interesting areas of activity and anomalies. The traffic playback function was a useful addition in monitoring vessel movements at key points in the week.
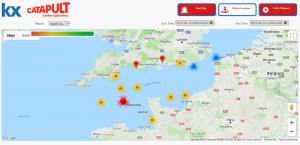
Figure 3 Visualisation of vessels in the English Channel
In Figure 3 above a pin indicates a single boat. The circle indicates a group of boats in the same location. The number on the circle represents the number of boats in that grouping. The color of the circles was created by the range of values within these circles with the highest number assigned red and the lowest assigned yellow.
| Number of records being queried | Execution time | Space used (in memory) |
|---|---|---|
| 191,878,279 | 3.550 sec | 5,784,448 bytes |
Table 3 All vessels in the English Channel query performance
Query 2: Transshipment Activity Monitoring for the English Channel
Transshipment at sea is done by transferring goods such as cargo, personnel, and equipment from one ship to another. A common practice in global fisheries this typically takes place between smaller fishing vessels and large specialized refrigerated transport vessels allowing operators to remain on the fishing grounds, consolidate fleet fuel costs and move catches to market much more efficiently. On the flip side of this, transshipment at sea can sometimes, accidentally or deliberately, confuse the actual source of the catch, complicating sustainable fisheries management, and may allow illegally caught fish to enter the legitimate seafood market.
To find vessels that are operating in transshipment mode, a time-interpolated query that finds features that intersect both in space and time is needed. Typically, these queries are very expensive in terms of memory usage. It’s also worth noting that spatio-temporal data visualization and analysis can be demanding due to the unlimited directions with space, i.e up, down, right, left, North,East, West, South and the fact that time can only go forward. Combining and evaluating the two attributes of space and time is not a straight forward task.
We asked Kx to perform a transshipment query for all the ships in the English Channel with a week’s worth of data and extracting information from message types 1,2,3,18,19,27. Each of these ships was cross-referenced against all of the other vessels within the English Channel traveling at possible transshipment speeds, to see if they were within a mile of each other. The query returned all ships that were found within a bounded box within a specific time interval. The telemetry information of the returned data was then used to group those vessels traveling very slowly or at a stop. All vessels that were within a mile of each other, were returned.
| Number of records being queried | Execution time | Space used (in memory) |
|---|---|---|
| 191,878,279 | 16 mins 2 sec | 5,247,995,712 bytes |
Table 4 Transshipment over English Channel query performance
Conclusion
As Geospatial Intelligence Engineering team, we experimented few solutions to ingest, analyse and visualise datasets as such AIS, ADS-B, and other sources of geo-temporal datasets as such as Twitter data feeds. Our favourable approach was to test open source technology. In particular, we consolidated our experiences over a fully distributed Apache open source stack. For ingestion, and analytics we used a composition of Spark, Hadoop, Accumulo DB. Apache Spark is a general framework for distributed computing that offers high performance for both batch and interactive processing. Spark keeps track of the data that each of the operators produces, and enables applications to reliably store this data in memory. This is the key to Spark’s performance, as it allows applications to avoid costly disk accesses.
Apache Spark requires a cluster manager and a distributed storage system. For cluster management, Spark supports standalone (native Spark cluster), Hadoop YARN. Our system was orchestrated by NiFI, an easy to use, powerful, and reliable system to process and distribute data. Our target infrastructure was running on a Virtual Private Cloud instance in CEMS, providing us with1 TB of RAM, and 9 TB of disk storage. Using this stack, we were been able to ingest, query and analyse up to 5 TB of data, serving up to 2M results in less then 20 sec for the spatial-temporal query over the whole dataset. The drawback was the memory footprint: the system under stress (multiple concurrent-queries, multi-users, multi-data ingestions) was claiming the whole amount of memory available, leaving the cluster not stable with the continuous needs of a data engineer to perform maintenance at cluster and code level. The solution was great in terms of flexibility, and potential development, but definitely expensive in terms of human intervention and hardware dedicated.
This left us with the desire to explore other solutions to handle geo-temporal data at scale. We were keen to start the collaboration with Kx under this POC, and explore the capabilities of their platform.
Even though, during this POC we used a datasets that was considerable smaller with the datasets that we used in the past (one order of magnitude smaller), I was personally fascinated on the limited hardware required to run the end-to-end platform, from ingestion to visualisation. It was enough to run a standard 32 GB RAM, 8 vCPUs, Linux box to start to perform analytics over datasets of a couple of months.
We were delighted with the performance of the Kx analytics solution and also impressed with the range of data analytics and developer functionalities that the platform provides. The dashboards element was intuitive and easy to customize for our use cases, providing a rich layer of visualization. Our experience demonstrated that Kx technology performed very well with the use of spatio–temporal datasets. We look forward to engaging with Kx and their people in the future for further productive collaborations.
Further Reading
Global Fishing Watch – public data sets
Global Fishing Watch promotes ocean sustainability through greater transparency using cutting-edge technology to visualise, track and share data about global fishing activity in near real-time and for free. Global Fishing Watch is committed to making as much of its data and code publicly available as possible. You can explore their datasets for download, some of which will take you to pages on GitHub with more documentation and details.
NASA FDL
The following blogs, Disaster prediction research at NASA FDL with kdb+/q, ML and AI Kx and Whitepaper: NASA FDL – Disaster Prevention, Progress and Response (Floods) provide interesting insights into how NASA FDL is partnering with organizations with backgrounds in the AI, technology and the space science sectors to apply AI methods to a broad range of global and space-related challenges.
The Kx Whitepaper: NASA FDL – Disaster Prevention, Progress and Response (Floods) looks at the problems of predicting the flood susceptibility of an area and predicting the time taken for a river to reach its peak height after a rainfall event. Kdb+ is used to manage and pre-process the time-series data, while Random Forest and XGBoost models are deployed via embedPy and the ML-Toolkit. The complete white paper is accessible on this link .
About Kx
Kx is a division of First Derivatives PLC (FD), winner of UK Tech Company of the Year at the UK Tech Awards in 2017, and a global technology provider with 20 years of experience working with some of the world’s largest finance, technology, retail, pharmaceuticals, manufacturing and energy institutions. FD operates from 14 offices across Europe, North America, and Asia Pacific, including its headquarters in Northern Ireland and employs more than 2,000 people worldwide.
Kx’s singular goal has been to provide our customers with the fastest, most efficient, and most flexible tools for processing real-time and historical data. For over two decades Kx has been setting the standard for in-memory time-series database technology. Kx analytic software platform includes the world’s fastest database system with integrated programming and visualization tools for developers and business users
Kx technology provides a highly performant analytical framework that allows for ease of integration with existing legacy solutions providers ultimately supercharging these systems. The ability to scale allows extreme performance on a small hardware footprint and Kx has been proven to handle 4.5 million
streaming events per core, per second; this scales both vertically and horizontally. Reporting and alerting frameworks can, therefore, be developed and designed to give true real time responsiveness. This performance and scale significantly reduce the total cost of ownership of both hardware and software and providing improved operational performance.
The key aim of Kx for Space is to:
- Enhance an institution’s capability to monitor and supervise data, to detect and investigate possible cases of malfunction and ultimately detect anomalies through the provision of powerful, insightful and meaningful analytics and alerts provided by Kx real-time capability
- Bring operational efficiencies, and cost reductions to monitoring, supervision, and enforcement tasks by using a sophisticated monitoring, analytical and signal detection platform
- Enable clients to keep pace with current best practices in surveillance and analytical technologies and techniques
- Provide the flexibility and scalability to adapt to an evolving space market landscape as new use cases and requirements are introduced and explored
- Deliver a user-friendly and flexible platform that allows for extreme scale
- Provide a performant, resilient and scalable solution
- Facilitate easy connectivity to internal and external data sources allowing for future growth and accommodation of increased data source variety and velocity as they become important and relevant to an institution’s operation