This is the first in a series of posts that explores how we see the market in Earth Observation (EO) data evolving and aims to give you some guidance to help you build solutions and access the data you need.
What is the satellite data market and why would you use satellite data?
The commercial satellite data market has been around for a few decades, but it is only relatively recently that we’re seeing huge growth in the market which is opening the doors for satellite data to be used in a wide variety of applications.
So, what is this data and why is it useful? To answer this question, let’s consider the sectors that began with an interest in collecting information from satellites orbiting the Earth:
- Defence – to image places and events of concern and build an intelligence picture
- Scientists – to study Earth processes, Anthropogenic processes and their interaction
- Meteorologists – to provide data for an operational weather service
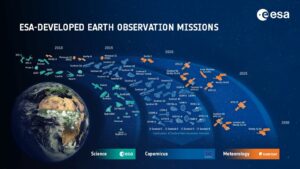
ESA-Developed Earth Observation Missions (credit: ESA)
These three sectors have had different needs influencing their growth and development. Weather forecasting needs to be increasingly accurate, scientists want to study changes over long periods of time and the defence industry has a constant drive for innovation, with higher resolution images needed more often. As space becomes more accessible, this innovation is being reflected in the evolving commercial market, the result being an increasingly diverse landscape of companies observing the Earth from space.
As consumers of this data, we now have access to a variety of different data types from space:
- Optical – Images of the Earth using the visible light spectrum (like a georeferenced photograph), some extending into the ultraviolet and infra-red spectrum.
- Radar – Covering several instrument types, but most notably Synthetic Aperture Radar (SAR) which provides images containing very accurate information about the distance of objects from the sensor
- Video – short videos captured from space
- Thermal – Infra-red data which can provide some heat information from space
- Greenhouse gas detection – Measuring concentrations of gases, such as carbon dioxide, methane, sulphur dioxide, nitrous oxides, etc.
- Meteorology – commercial weather data
- Positioning, Navigation and Timing (PNT) – Though not imaging sensors, these provide geospatial information based on Global Navigation Satellite Systems (GNSS) and often with additional data attached, such as Automatic Identification System (AIS) information about ships or Automatic Dependent Surveillance-Broadcast (ADS-B) information about aircraft which can be used together with imagery.
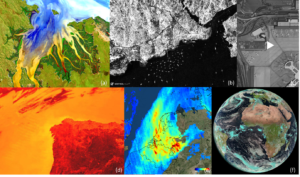
Figure: exemplary EO imagery: (a) optical (© NASA), (b) radar (© ESA), (c) video (© Satellogic), (d) thermal (© NASA), (e) GHG (© ESA), (f) meteorological (© EUMETSAT)
High resolution, frequent satellite imagery is now available for purchase from a large number of international providers; the technology and applications of the data are well understood, we should be on the “productivity plateau” of the Gartner Hype curve, but uptake in new sectors remains slow.
Industry leaders outside of the space sector have been approached, sometimes with excitement from space engineers, about using “Earth Observation” (EO) data in their products, which can lead to pushback as the proposal is not contextualised. The generalised benefits (listed below) of using space-based data are usually presented, rather than solutions that target consumer needs.
- Regular revisit
- Global coverage
- All-weather, day-night monitoring (for SAR)
In our work supporting SMEs we’re very aware of the work that needs to be done in moving from a technology-first approach to developing a clear business case, but this thinking has not always been applied at an industry level and those of us seeking to increase use uptake of satellite data should be conscious of this when integrating EO data into solutions outside of the space sector.
New solutions must be developed in partnership with end users. As exciting as our EO technology is to us, we cannot understand the subtleties of the user’s needs if they are outside of our sector. For example, interferometric SAR (InSAR) is a fascinating technique that allows the detection of millimetre scale changes from space but used in isolation it cannot fully address all aspects of a civil engineering problem.
Once such solution is BRIGITAL. BRIGITAL software has been jointly developed by the National Research Council of Canada and Satellite Applications Catapult. The pilot study tool visualises data on the national network of bridges in Canada to deliver indicators on structural stability and safety.
BRIGITAL processes and analyses data from a range of sources, including satellites, ground sensors, and visual inspections, and displays any vertical displacement of bridges over time with millimetre accuracy. This real-time monitoring can aid users in deciding when and where to focus resources to pre-empt large scale damage or collapses. The visualisation tool displays the changes in structure and is developed as an early-warning tool, comparing automatically predicted movements against satellite measurements and indicating potential problems to users, thus allowing for early intervention.

BRIGITAL – showing the relative displacements of Victoria Bridge, Canada
Other projects the Catapult is involved in that bring together end users and supply chain partners, include Innovation for Clean Air (IfCA https://sa.catapult.org.uk/projects/ifca/), an international collaborative project seeking to address air pollution and emission reduction in Bengaluru, India, and ForestMind (https://forestmind.org), a collaborative project developed to help eliminate products that have caused deforestation from our food supply chains.
Focus on the solution, not the space data.
In addition to slow uptake, over the last few years, several high-profile articles have raised awareness of the difficulties that users face accessing commercial satellite data (e.g. https://joemorrison.medium.com/satellite-imagery-is-not-becoming-a-commodity-f8181017d27), but what do you need to be aware of, as a user of satellite EO data, navigating this market?
How do you go about accessing satellite images of the earth?
EO data is available via two main routes:
- Open data, primarily from science missions and the Copernicus Programme
- Commercial data from privately operated satellites and constellations.
Open Data Evolution and Access
Open data mainly comes from EO science missions that have not traditionally had a single application focus, they have been designed to capture to the widest possible set of parameters for environmental monitoring, some hosting multiple payloads (or instruments) on-board a single satellite, e.g. Envisat – an ESA giant which operated for double its expected lifetime and contained multiple EO instruments. One of the primary considerations in the design of these satellites has been data continuity, namely, the ability for scientists to study timeseries of data over multi-year or multi-decade timescales. This need for continuity has constrained some elements of the evolution of the technology; advances are being made in coverage and quality, but typically the resolution remains moderate, as we have seen in the Sentinel satellites.
Opening EO data to be freely accessible has enabled the development of new products and services, but given the limited spatial resolution, these are best focussed on answering questions where wide area coverage is more important than detailed analysis.
Open data in summary:
- Useful for larger area coverage
- Typical resolution on the ground is upwards of 10mx10m (i.e. objects or areas need to be several times this size to be recognisable on the image)
- Suitable for long time-series analysis
Access to open data is often via web portals, which is the easiest entry point, and is usually supported by API which allows scalable solutions to be built. Help desks, data specifications, quality information and handbooks are usually available, particularly from the agency operating the satellite. There are usually multiple mirror sites and country archives where the data can be accessed which may add to confusion!
For users familiar with cloud services, shorter-term rolling archives can be accessed directly through many cloud providers.
The Catapult supports users to navigate this complex landscape of solutions. Our SeDAS side signposts multiple sources for free data (https://sedas.satapps.org/) and even links to repositories for useful code, and platforms where analysis can be performed.
Commercial Data Evolution and Access
The commercial EO data market has been growing rapidly, but the issues surrounding data uptake are leading to an increasing number of companies developing “vertically integrated” solutions, this means that they are building many of the building blocks needed to serve a particular customer sector. With the decrease in launch costs afforded by increasing re-usability and ridesharing, some companies even design and launch satellites so that they can build services to address specific needs within a sector. Where more generic imagery systems are being launched, the government customer is seen as a key, and knowledgeable, user of satellite data, ideal as an anchor customer and it can be hard for smaller users of the data to make an impact or achieve meaningful bulk cost reductions when purchasing directly.
Commercial data in summary:
- Usually, higher resolution, with pixels representing up to 30cm x 30cm on the ground
- Some novel sensors (e.g. thermal, gas detection)
- In most cases, archives cover a shorter time period, though some suppliers have data going back to the mid to late 1990s. These datasets might not be continuous due to sensor and processing improvements.
- Archive data is usually cheaper, but much more sparse than open data.
- Entry points for purchase and tasking are varied
- Often a minimum purchase or a subscription may apply.
- Licensing influences cost
- Planned usage must be well defined to select the right license
For any user looking to purchase data, the journey may seem daunting, but addressing these questions first can help to narrow down the providers you need to talk to and shorten the process:
- What do you need to be able to interpret in the imagery?
- Do you need to share the imagery with a customer, or just information you have derived from that imagery (e.g. as a report, a shapefile or an annotated overlay on an open-source map)?
- Do you need new or specially tasked data?
- How regularly, if at all, do you need similar data?
- Do you want to use the data on a portal, or download the data to another location?
- What is your minimum data need (in square km)?
- Do you need a specific, oddly shaped area?
- What is your budget?
You should expect to be asked many questions as most suppliers price their data according to end use and how the images and derived information will be shared.
An alternative approach is to speak to a data reseller. Data resellers have access to data from multiple satellite operators and often have an advantage in being able to compare prices across providers.
Fortunately, the access difficulties are being recognised and innovations are creeping into this area.
Cloud computing has changed how we interact with the data, in many cases offering users data access alongside the compute services, dramatically increasing the options for scaling services to global coverage. Satellite operators and resellers are starting to provide portals that allow users to browse their catalogues, and some now offer direct satellite tasking e.g. Capella Space with their Constellation Tasking (https://www.capellaspace.com/data/constellation-tasking/) and Maxar with their Rapid Access Program (https://www.maxar.com/products/rapid-access-program). We are also seeing an increasing drive towards consolidation of catalogues across providers and technologies that can support easier data searches. Geocento (https://geocento.com/earthimages), for example, is offering a platform that allows users to search consolidated data catalogues across multiple providers to simplify data access and provide clear pricing. A need for standardisation to enable better uptake is clear and innovations, such as the SpatioTemporal Asset Catalogue (STAC) specification (https://stacspec.org/en), are starting to usher in new opportunities to open the metadata from catalogues in ways that will let users view and compare what data is available across multiple suppliers. Hopefully, the newest comers to the market will embrace innovation in this area and accelerate a simpler access system for users.
These improvements in data access and supporting infrastructure are opening doors for new services at all kinds of scales. Improved data access and the opening of data and software licences is changing the way we work, making it easier to transition from the processing of a couple of manually downloaded images to building fully-automated global, cloud-based solutions.
At the Catapult we can help both users of EO data and suppliers of EO data to develop solutions that meet their customers’ needs. If you have any questions, please do not hesitate to get in touch with us.